Impact Scenario
Day 0 | Day 1 | Day 2 | Day 3 | | Day 4 | Day 5
This webpage does not describe a real potential asteroid impact. The information on this page is fictional and provided only to support an emergency response exercise conducted during the International Academy of Astronautics (IAA) 2017 Planetary Defense Conference in Tokyo, Japan, May 15-19, 2017. This is only an exercise.
The 2017 PDC Hypothetical Asteroid Impact Scenario
An asteroid is discovered on March 6, 2017, at magnitude 21.1, and confirmed the following day. It is assigned the designation "2017 PDC" by the Minor Planet Center. (To reinforce the fact that this is not a real asteroid, we are using three letters in the designation, something that would never be done for an actual asteroid.)
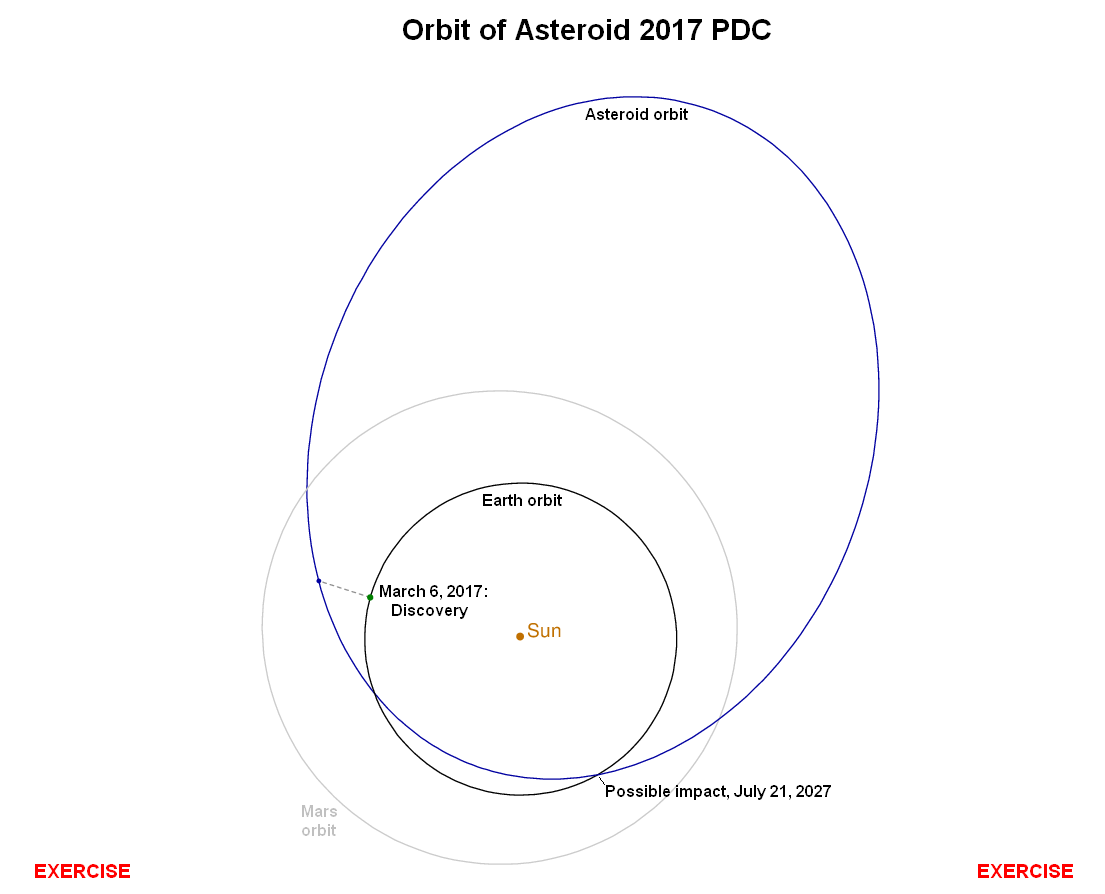
Initial calculations indicate that 2017 PDC's orbit approaches well within 0.05 au to that of the Earth, and it is therefore classified as a Potentially Hazardous Asteroid (PHA). (The unit "au" stands for "astronomical unit", which is the mean distance of the Earth from the Sun, 149,597,870.7 km, or 92,955,807 miles.) The orbit is eccentric, extending from a distance of 0.88 au from the Sun at its closest point to 3.60 au at its farthest point. The asteroid's orbital period is 1225 days (3.35 years), and its orbital plane is inclined 6.3 degrees to the orbit of the Earth.
The day after 2017 PDC is discovered, JPL's Sentry impact monitoring system, along with ESA's similar CLOMON system, both identify several future dates when this asteroid could potentially impact the Earth. The date of the most likely potential impact is July 21, 2027 - over ten years away - but the probability of impact is very low, about 1 chance in 40,000.
When first detected, the asteroid is about 0.36 au (54 million kilometers or 33 million miles) from Earth, approaching our planet and getting brighter. It is observed extensively, and as the observational dataset grows, the impact probability for 2027 increases. The asteroid peaks in brightness at magnitude 20.4 on April 7, by which time the impact probability has risen to nearly 0.2 percent.
Very little is known about the asteroid's physical properties. Based on the apparent visual magnitude, its absolute (intrinsic) magnitude is estimated to be about H = 21.9 +/- 0.4. But since its albedo (reflectivity) is unknown, the asteroid's mean size could be anywhere from 100 meters to over 250 meters.
2017 PDC approaches the Earth for well over a month after discovery, and it reaches its closest point of about 0.13 au in late April. Unfortunately, that is too far to be detected by Goldstone radar, and too far south for Arecibo radar. The asteroid is not expected to pass close to the Earth again, until the potential impact in 2027.
Observers track the asteroid almost daily since discovery, and the impact probability for 2027 continues to rise. As of May 15, 2017, the probability of impact has reached about 1%. The rest of the scenario will be played out at the conference.
Here are additional details on what we know about 2017 PDC on the first day of the conference:
The following diagram shows the orbits of 2017 PDC and Earth, along with their positions when the asteroid was discovered on March 6, 2017, and the point at which the orbits intersect. The asteroid makes just over 3 orbits of the Sun between discovery and the potential impact.
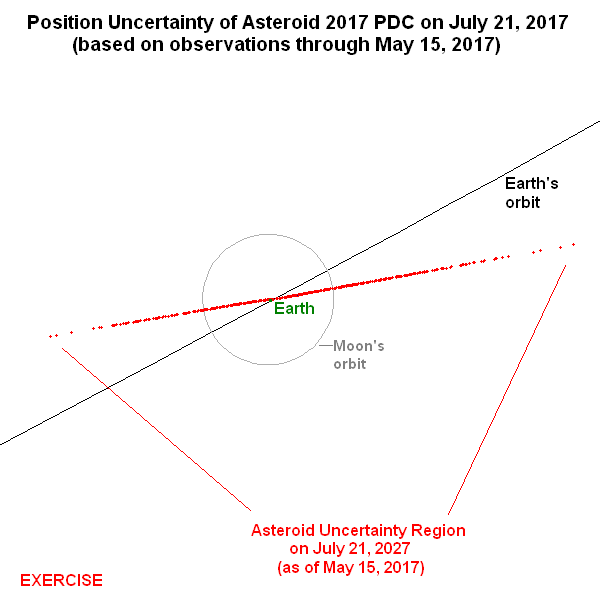
The following diagram zooms in on the intersection point of the orbits of 2017 PDC and the Earth, and shows the current uncertainty in the predicted position of the asteroid when the Earth crosses through the intersection point on July 21, 2027. The uncertainty region is several times longer than the diameter of the Moon's orbit. As the asteroid is observed over the subsequent weeks and months, the uncertainty region will shrink in size.
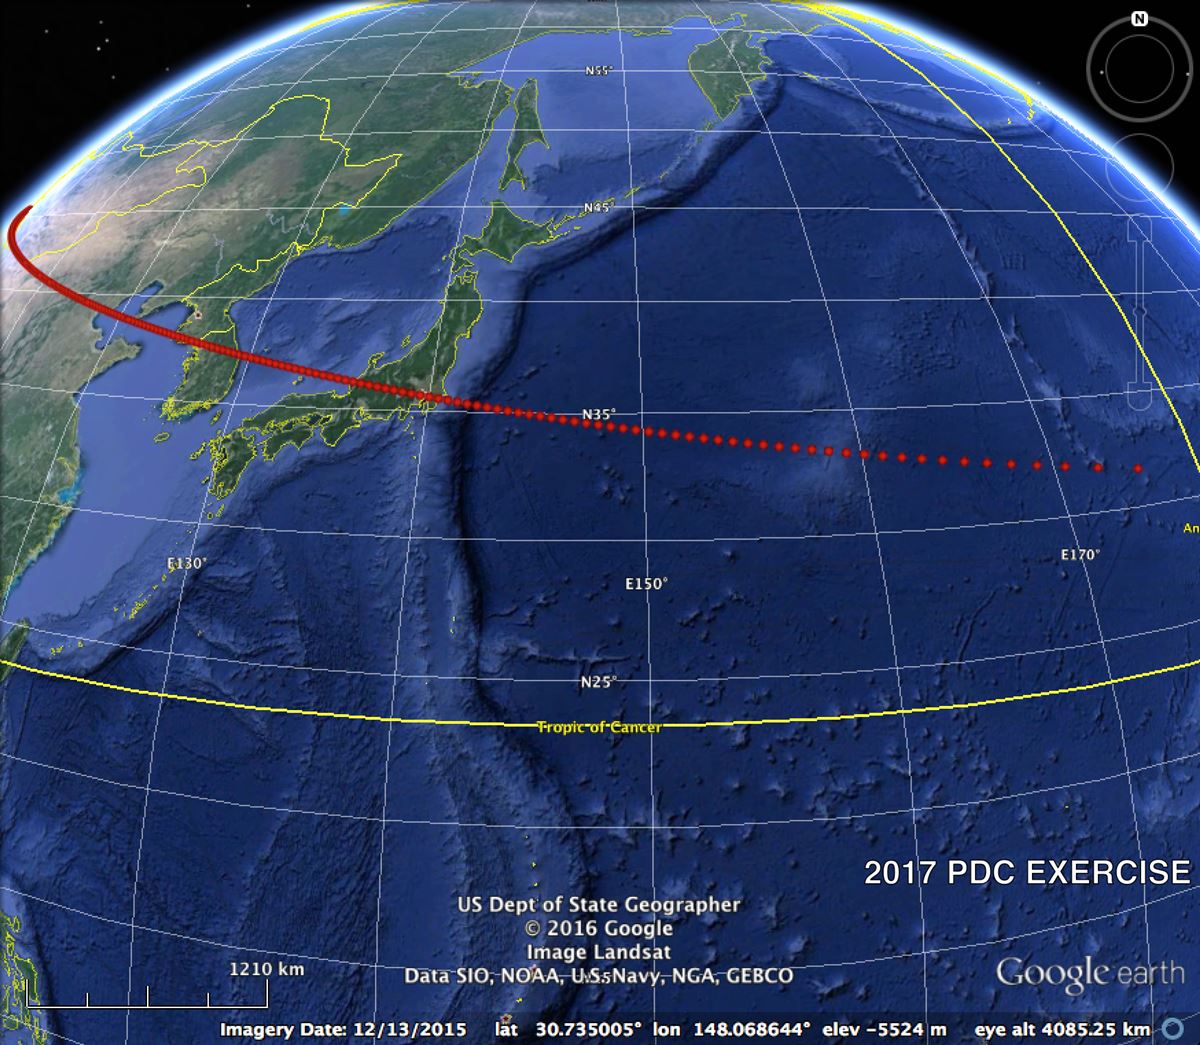
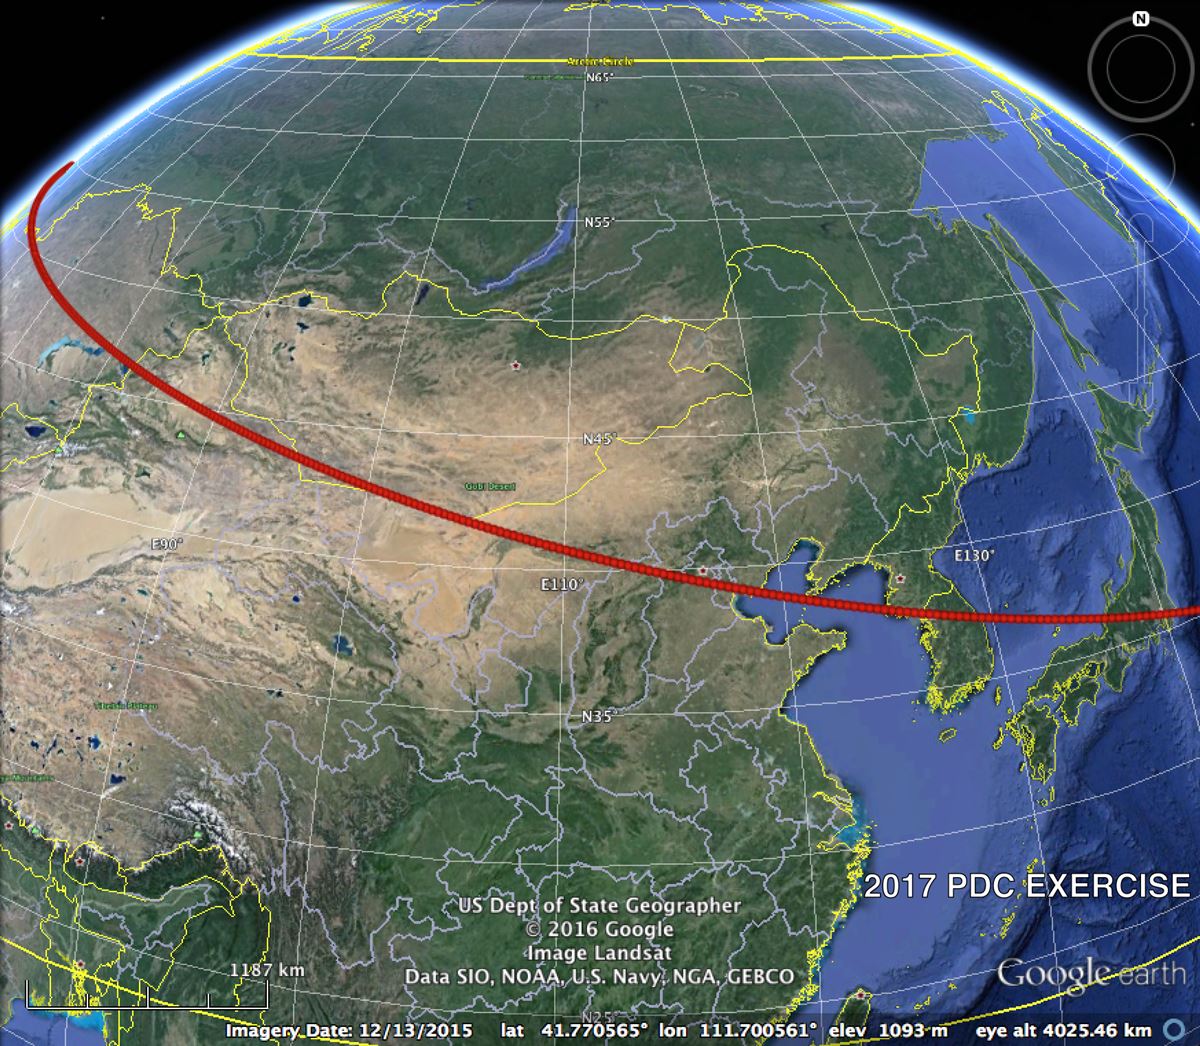
The asteroid's uncertainty region at the time of the potential impact is much longer than the diameter of the Earth, but its width is much less. The intersection of the uncertainty region with the Earth creates the so-called "risk corridor" across the surface of the Earth. The corridor wraps more than halfway around the globe, spanning from the North Pacific on the eastern end, through Asia and Europe, all the way to the North Atlantic on the western end. The red dots on the following three Google Earth images trace the risk corridor:
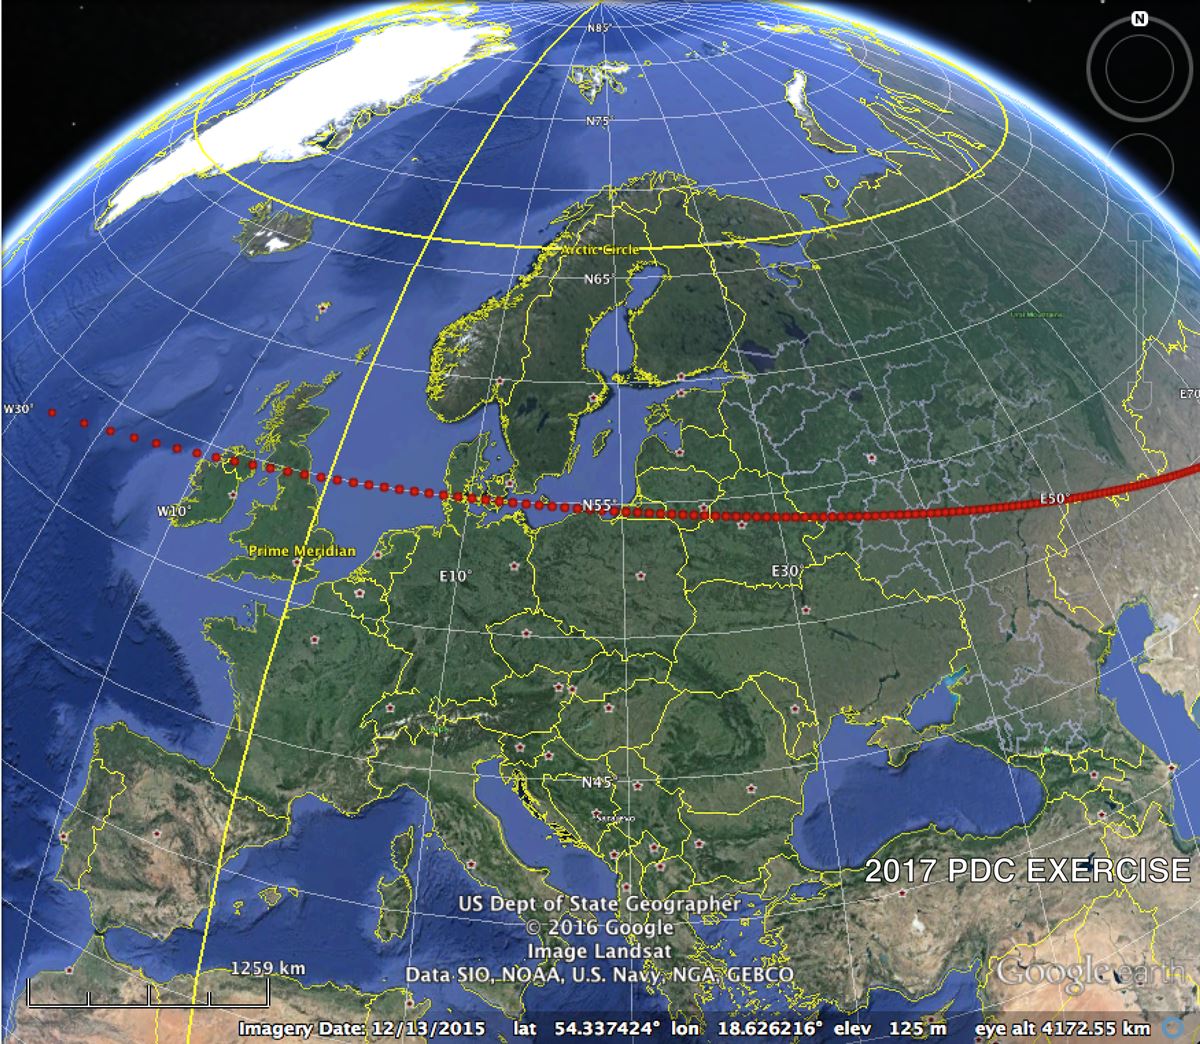
A Google Earth kml file for these impact points is available here.
A table of the impact circumstances of the points along this corridor can be found here. The columns of this table are as follows:
☆ xi & zeta are the Opik b-plane coordinates of the trajectory, in kilometers
☆ Lat & ELon are the latitude and East longitude of the impact point, in degrees
☆ Vel is the velocity at impact, in km/s
☆ Az & El are the azimuth (measured eastwards from North) and elevation of the incoming velocity vector, in degrees
☆ Time is the UTC time of the impact on the impact date, 2027-Jul-21.
At this point in the scenario, when the impact probability is low, the impact points along the risk corridor are all essentially equally likely. Note that the points become more widely spaced towards the ends of the corridor because the asteroid enters at shallower and shallower elevation angles.
The asteroid should become observable again in late May, although it will be faint at a visual magnitude of about 23, observers will require fairly large (2-meter-class) telescopes to track it. Although receding from the Earth, the asteroid remains about this bright through September, when it starts fading further to 24th and 25th magnitudes. At that point, observers will require very large aperture telescopes such as the 4- and 8-meter class facilities of CFHT, Keck, Gemini, Subaru, VLT, etc., to track the object. In December 2017, the asteroid will fade to 27th magnitude and remain essentially unobservable for almost a year.
A special version of the JPL orbit viewer applet has been created for this object and can be accessed here:
http://neo.jpl.nasa.gov/orbits/pdc17.html
The orbit for the central point of the risk corridor for 2017 PDC has been loaded into JPL's HORIZONS system, and can be accessed via the name "2017 PDC". HORIZONS can be accessed with this object preloaded via this web-interface here.
For those familiar with the SPICE Toolkit software, an SPK file for this same orbit has been created and is available here:
ftp://ssd.jpl.nasa.gov/pub/xfr/2017-PDC/2017_PDC-merged-DE431.bsp
The SPK file is consistent with and contains additional DE431 planetary ephemeris information over the time-span 1995-Jan-01 though impact on 2027-Jul-21, permitting retrieval of object state vectors at any arbitrary instant within that timespan.
The orbit for the central point of the risk corridor for 2017 PDC has been loaded into the JPL/Aerospace Corp. NEO Deflection App . This on-line tool allows users to study the velocity change (delta-v) required to deflect 2017 PDC off the Earth, as a function of deflection time. Specific amounts of impulsive velocity change can be applied at specific times before impact and the resulting deflection in the impact b-plane is shown. The App can also be configured to calculate kinetic impactor spacecraft trajectories, as well as the spacecraft masses that can be launched onto those trajectories by various launch vehicles. The App calculates the delta-v applied to the asteroid when the kinetic impactor hits it, and determines the Opik b-plane coordinates, xi and zeta, of the deflected trajectory. Using these coordinates, you can roughly determine the impact point of the deflected trajectory by interpolating in the table of impact circumstances given above. A complete description of the app is available here:
http://neo.jpl.nasa.gov/nda
The 2015 PDC trajectory is also loaded into the App along with trajectories of several other simulated Earth impactors.
Notes : March 09, 2017
